What This Pattern Actually Shows
Candles vs chart context ka main lesson yeh hai ki same candle alag jagah par alag meaning de sakti hai. Context ke bina candle shape misleading ho sakti hai. Chart context me trend, support-resistance, range structure, breakout zone, volume aur higher timeframe direction sab aate hain. Yahi concept beginner ko isolated pattern thinking se nikal kar contextual reading ki taraf le jata hai.
How This Pattern Forms
Candle form hamesha same mechanics se hoti hai, but interpretation context-dependent hoti hai. Long wick support par rejection ho sakti hai, resistance par exhaustion, aur middle me noise bhi. A candle chart ke andar tabhi useful hoti hai jab aap poochho ki yeh kis move ke baad bani aur kis level ke around bani. Pattern formation aur context together hi trade quality define karte hain.
Buyer and Seller Pressure
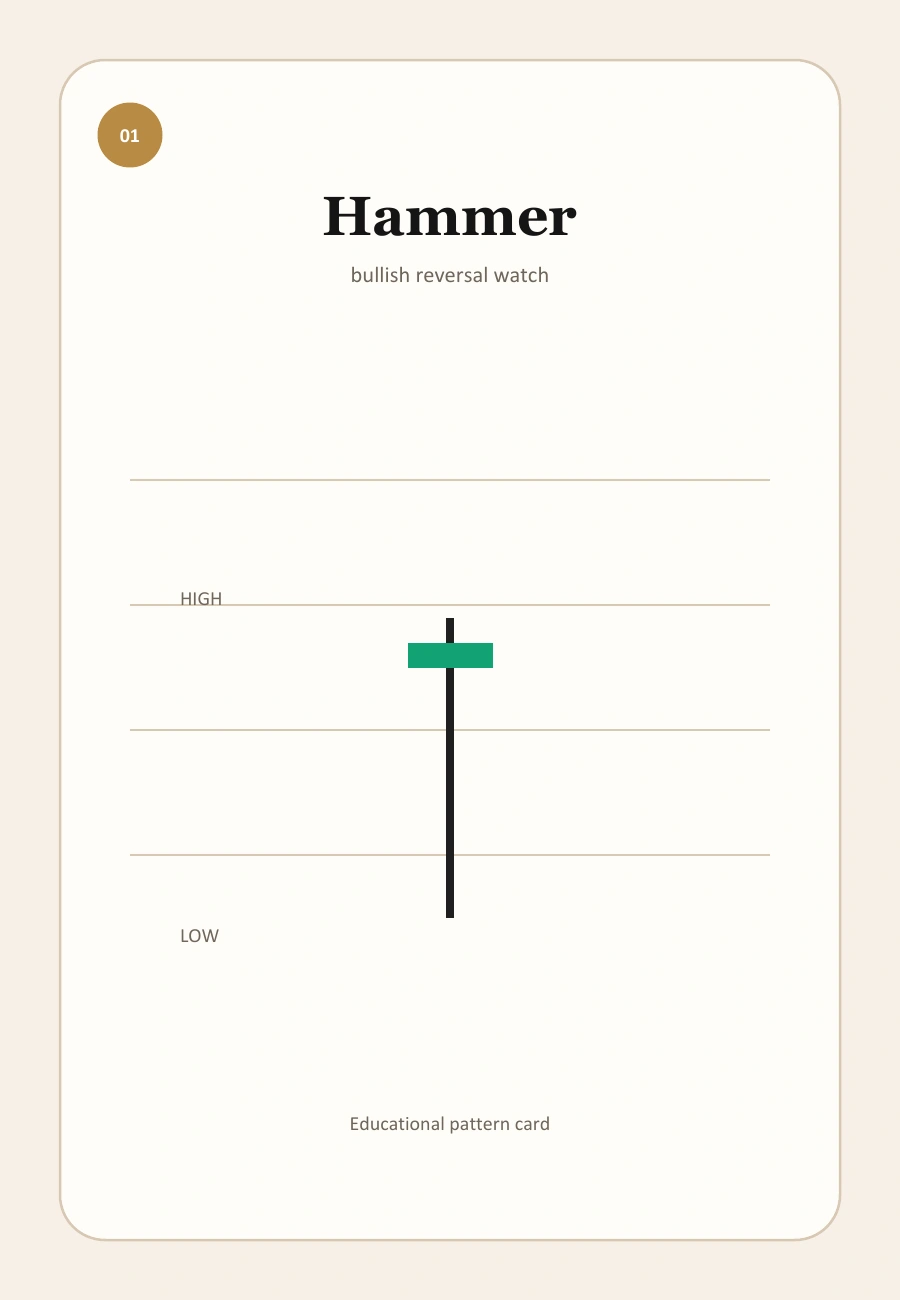
Buyer-seller pressure ko context amplify ya dilute karta hai. Support ke paas buyer rejection strong clue ho sakta hai, lekin uptrend ke middle me same structure bas pause ho sakta hai. Isi tarah bearish-looking candle strong breakout trend me sirf pullback candle bhi ho sakti hai. Chart context crowd behaviour ka larger frame deta hai, candle us frame ka detailed clue.
How Beginners Should Use It Practically
Practical use me pehle chart location mark karo, then candle read karo. Agar dono align karte hain to setup quality improve hoti hai. Beginner ko candle dekhkar entry nahi, context dekhkar candle ka meaning decide karna chahiye. Confirmation rules context ke hisab se shift hoti hain; breakout, reversal aur range setups sab ka reading style different hota hai.
Common Mistakes Beginners Make
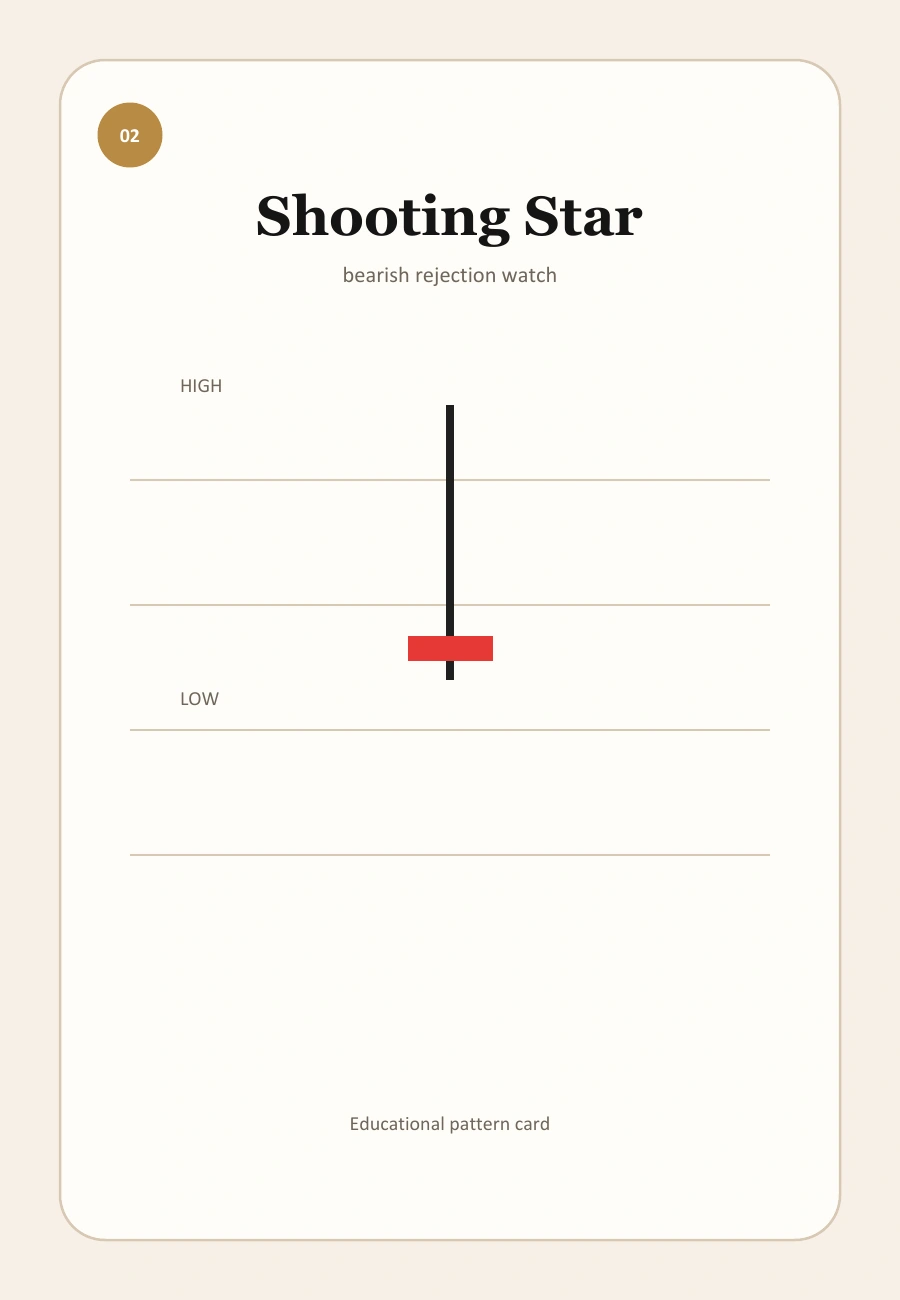
Sabse common mistake pattern-first approach hai. Doosri galti support-resistance draw hi nahi karna hai. Teesri galti lower timeframe noise ko larger context se alag padhna hai. Context ignore karoge to same pattern kabhi overtrade aur kabhi wrong-side trade ban sakta hai. Candles ko map aur context ko terrain samjho; dono saath me chahiye.
Most Beginners Miss This
Pattern location matters more than pattern name. Chart context ke bina strong-looking candle bhi weak decision trigger ban sakti hai.
Seedha Samjho
Candles tab zyada useful banti hain jab unhe isolated shapes ke bajay market behavior ki tarah padha jaye. Context decide karta hai ki same pattern meaningful hai ya sirf visual noise.
Candle future predict nahi karti. Yeh sirf itna dikhati hai ki us period ke andar price ne pressure, rejection, indecision ya momentum kaise show kiya.
Pattern strongest tab hota hai jab yeh important zone par bane aur next evidence uske message ko support kare.
Ek aur practical point yeh hai ki candles vs chart context ko sirf ek ideal textbook image se nahi, multiple examples se study karna chahiye. Real charts messy hote hain, isliye pattern quality ko usually perfect yes-or-no label ke bajay spectrum par judge kiya jata hai.
Real Chart-Reading Situation
Jo candle beech me kahin bhi impressive lag rahi ho woh shayad kuch khas na kare, jabki important level par bani simpler candle better follow-through de sakti hai. Location meaning ko change kar deti hai.
Chart read karte waqt candle ko akela mat dekho. Pehle check karo ki yeh trend ke saath hai ya against, nearby support-resistance kya hai, aur kya next candle ne follow-through diya.
Entry, stop-loss aur target ko educational example ki tarah hi dekho. Pattern achha dikhne se trade automatically good nahi ho jata.
Ek useful chart-reading habit yeh hai ki candle ko usse pehle wali candles ke saath compare karo. Is comparison se pata chalta hai ki current bar really behavior change dikha rahi hai ya sirf same noise ko different shape me repeat kar rahi hai.
False Signal Warning
Common mistake yeh hai ki chart context check karne se pehle pattern name hi trade decide kar de. Yeh usually analysis ko ulta kar deta hai.
False signals tab zyada milte hain jab traders mid-candle act karte hain, low-volume move ko real breakout samajh lete hain, ya reward space dekhne se pehle hi entry le lete hain.
Beginners ko especially candle close, next-candle confirmation aur invalidation level par dhyan dena chahiye.
Chart context hi decide karta hai ki candle useful clue hai ya sirf random shape. Beginners tab faster improve karte hain jab woh exact level mark karte hain jahan candle idea fail hota hai, kyunki invalidation vague pattern interest ko clear risk decision me convert kar deta hai.
How To Combine It With Real Decision-Making
Candles ek decision stack ka part ban kar better kaam karti hain: trend, level, volume, confirmation aur risk. In layers ko hata do to candle message kaafi weak ho jata hai.
Better chart-reading ke liye is pattern ko trend, support-resistance, volume aur risk management ke saath combine karo. Jitna structured framework hoga, utna candle ka message zyada clearly samajh aayega.
No-trade decision bhi valid decision hota hai. Agar context weak ho ya stop-loss awkward ho, to pattern dekhkar bhi skip karna smart ho sakta hai.
Yeh educational examples aur actual setups ko alag karne me bhi help karta hai. Agar candle ko logical stop-loss aur realistic target space ke saath connect hi nahi kiya ja sakta, to woh study ke layak ho sakti hai, lekin zaroori nahi ki trade ke layak bhi ho.
Quick FAQs
Yeh candlestick pattern actually kya dikhata hai?
Candles tab zyada useful banti hain jab unhe isolated shapes ke bajay market behavior ki tarah padha jaye. Context decide karta hai ki same pattern meaningful hai ya sirf visual noise.
Real chart me beginner isse kaise use kare?
Jo candle beech me kahin bhi impressive lag rahi ho woh shayad kuch khas na kare, jabki important level par bani simpler candle better follow-through de sakti hai. Location meaning ko change kar deti hai.
Is pattern ke saath common beginner mistake kya hota hai?
Common mistake yeh hai ki chart context check karne se pehle pattern name hi trade decide kar de. Yeh usually analysis ko ulta kar deta hai.
Sirf ek candle enough kyun nahi hoti?
Candles ek decision stack ka part ban kar better kaam karti hain: trend, level, volume, confirmation aur risk. In layers ko hata do to candle message kaafi weak ho jata hai.
Disclaimer
Yeh page sirf educational purpose ke liye hai. Koi bhi candlestick pattern guaranteed reversal, guaranteed continuation, ya guaranteed profit signal nahi hota.