What a Trend Really Means
Trend ka simple matlab hai market kis direction mein mainly move kar raha hai. Uptrend mein price generally higher highs aur higher lows banata hai. Downtrend mein lower highs aur lower lows. Sideways market mein clear direction absent hoti hai.
Trend important isliye hai kyunki same signal trend ke saath aur trend ke against different quality ka hota hai. Pullback buy uptrend mein stronger lag sakti hai compared to same pattern downtrend ke beech.
Many beginner losses isliye aate hain kyunki woh signal dekhte hain, trend nahi. Market ka background bias samajhna first filter hona chahiye.
How Trendlines Help on Charts
Trendline ek visual tool hai jo uptrend mein higher lows ya downtrend mein lower highs ko connect karke direction aur rhythm samajhne mein help karta hai. Yeh exact science nahi hai, lekin structure ko clean banata hai.
Uptrend line tab useful hoti hai jab repeated pullbacks roughly same slope par respect karte dikh rahe hon. Downtrend line selling pressure ko track karne mein help karti hai. Trendline break kabhi-kabhi early warning ho sakta hai, but by itself reversal proof nahi hota.
Example: agar Bank Nifty repeated pullbacks par rising trendline hold kar raha hai, trader trend continuation ka bias maintain kar sakta hai until line aur structure dono weak na ho.
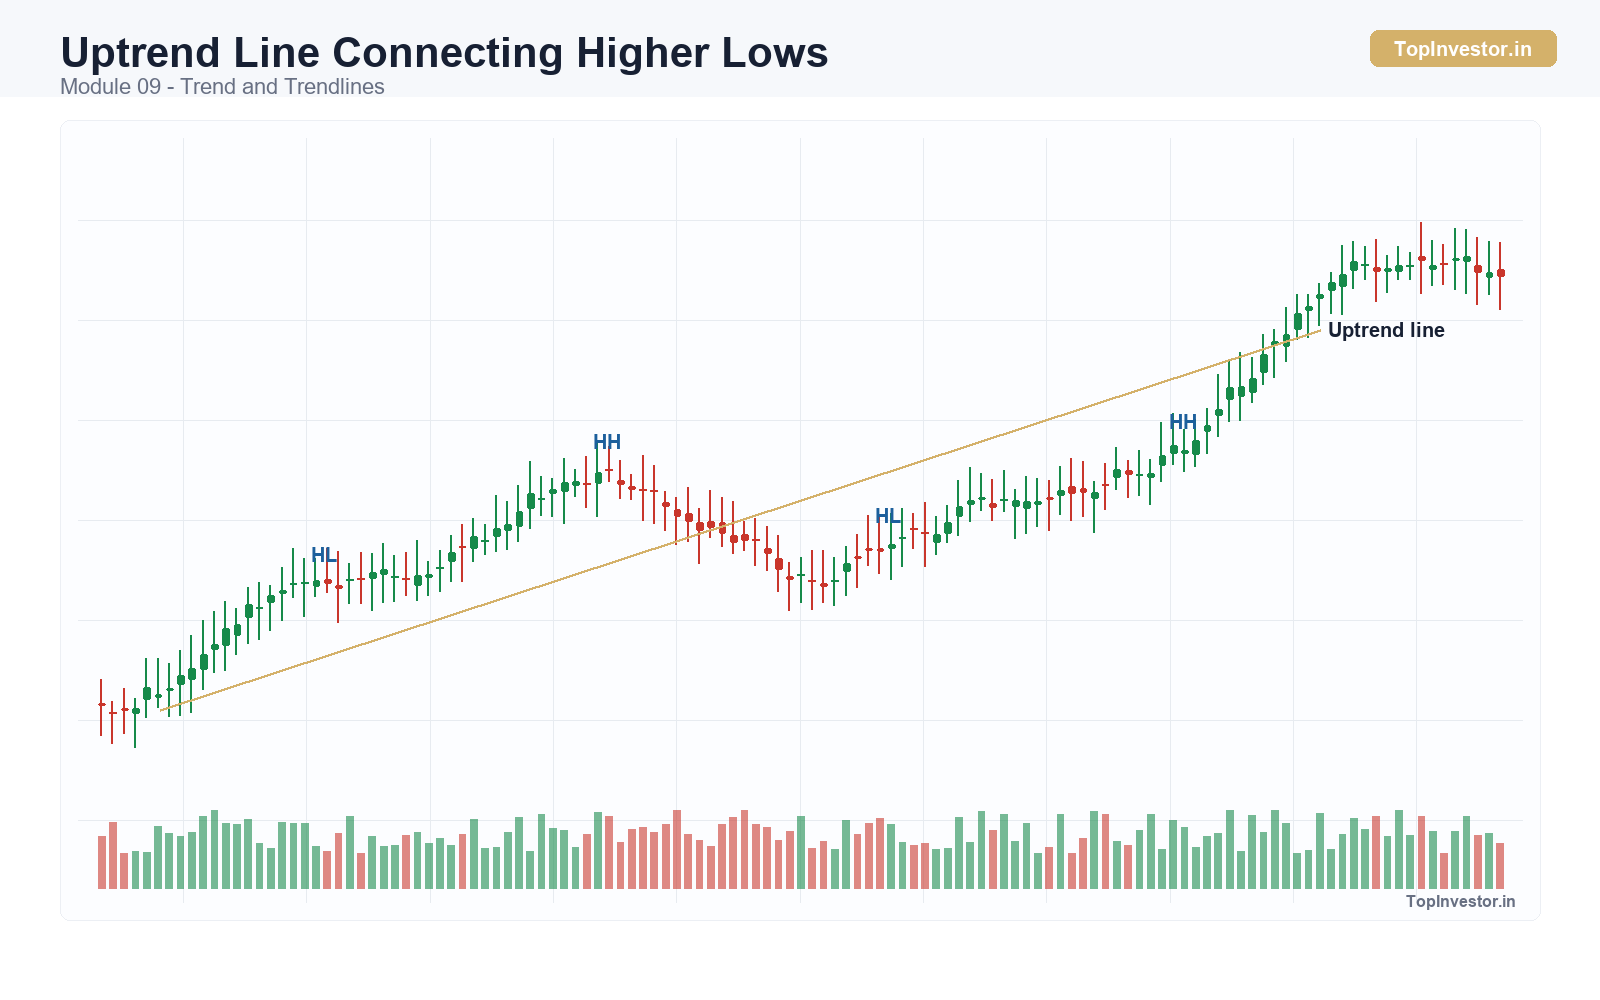
Uptrend Line Connecting Higher Lows
How to Use Trendlines Practically
Trendline best tab kaam karti hai jab aap usse support-resistance ya structure ke saath combine karo. Sirf line touch dekhkar blind trade mat lo. Dekho kya price rejection dikhata hai, kya nearby horizontal level bhi align karta hai, aur kya volume supportive hai.
Trendline break ke baad immediate reversal assume karna risky ho sakta hai. Kabhi line break hoti hai but structure hold karta hai, aur market bas steeper slope se flatter slope par shift hota hai. Isliye break ke baad retest aur follow-through observe karo.
Trendline se stop-loss logic bhi mil sakta hai, especially jab line clear swing structure ke saath match karti ho.
Common Beginner Problems With Trendlines
Sabse common problem har do points ko line se jod dena hai. Forced trendline ka koi value nahi. Agar line ko fit karne ke liye aap candles ignore kar rahe ho, to line weak hai.
Doosri mistake trendline break ko full reversal samajhna hai. Trendline break momentum slowdown ho sakta hai, range start ho sakti hai, ya actual reversal bhi. Confirmation structure se milega.
Third mistake timeframes ko ignore karna hai. 15-minute trendline daily trend ke against ho to uska influence limited ho sakta hai.
Most Beginners Miss This
Trendline market ka supporting evidence hai, core reason nahi. Agar horizontal level aur structure disagree kar rahe hain, sirf trendline par overconfidence dangerous ho sakta hai.
Seedha Samjho
Trend market ka directional bias batata hai, aur trendline yeh visualize karne mein help karti hai ki woh bias ab bhi respect ho raha hai ya nahi.
Is concept ka use chart reading ko clearer banane ke liye karo, complicated banane ke liye nahi. Ek clean idea with proper context, aksar dus conflicting signals se better hota hai.
Real Chart Mein Iska Practical Use
Isi liye experienced traders process ko simplify karte hain. Unka focus weak information hata kar sirf un factors par rehna hota hai jo execution ko genuinely better banate hain.
Valid trendline meaningful swing points ko connect karti hai aur tab best kaam karti hai jab broader market structure bhi usse support kare. Force ki hui lines false confidence deti hain.
Practical test simple hai: setup dekhne ke baad pucho kya chart ab bhi space, confirmation aur logical trade location de raha hai. Agar nahi, to setup educational ho sakta hai, tradable zaroori nahi.
Chart-reading example: agar uptrend stock trendline ke paas aake bounce kare, lekin har bounce previous bounce se weak hota jaye, to sirf line hold dekhna enough nahi hai. Trendline ke saath swing structure aur volume response bhi dekhna chahiye.
Most Beginners Miss This
Yahi step chart reading ko random button-clicking se alag karta hai. Setup tabhi attention deserve karta hai jab evidence, timing aur location ek saath align ho.
Risk Management Se Connection
Most Beginners Miss This: trendline guide hoti hai, proof nahi. Trendline break tab zyada important hota hai jab structure loss, volume shift ya failed retest bhi saath mein ho.
Trendline-based trade tab best hota hai jab trendline setup ka sirf ek part ho. Entry aur stop ko actual price behaviour par base karo, sirf drawn line par nahi.
Technical setup tab stronger hota hai jab stop-loss structure se aaye aur target realistic chart space se. Isse reward-to-risk emotional hone ke bajay grounded rehta hai.
Strong setup bhi fail ho sakta hai, lekin well-planned setup aksar controlled tareeke se fail hota hai. Trading mein yeh difference bahut important hota hai.
Trendline break ko akela trade trigger mat banao. False breaks common hote hain, especially jab broader structure abhi intact ho. Trigger tab stronger hota hai jab break ke baad retest fail ho ya lower high bhi confirm ho.
Quick FAQs
Is topic ko sabse simple tareeke se kaise samjhein?
Trend market ka directional bias batata hai, aur trendline yeh visualize karne mein help karti hai ki woh bias ab bhi respect ho raha hai ya nahi. Pehle clarity lao, phir speed.
Beginner ise live chart par kaise use kare?
Valid trendline meaningful swing points ko connect karti hai aur tab best kaam karti hai jab broader market structure bhi usse support kare. Force ki hui lines false confidence deti hain. Agar chart confirmation ya move ka room nahi de raha, to wait karna aksar better decision hota hai.
Yahan beginners sabse zyada kya galat samajhte hain?
Most Beginners Miss This: trendline guide hoti hai, proof nahi. Trendline break tab zyada important hota hai jab structure loss, volume shift ya failed retest bhi saath mein ho. Yehi ek insight beginners ko low-quality entries se kaafi bachata hai.
Yeh risk management se kaise connect hota hai?
Trendline-based trade tab best hota hai jab trendline setup ka sirf ek part ho. Entry aur stop ko actual price behaviour par base karo, sirf drawn line par nahi. Achhi analysis tabhi tradable banti hai jab risk clearly defined ho.
Disclaimer
Yeh page sirf educational purpose ke liye hai. Koi bhi pattern, indicator, breakout, ya setup guaranteed profit nahi deta. Isse financial advice ya trade recommendation ki tarah treat na karein.