What Compression Patterns Actually Show
Triangles aur wedges aisa market dikhate hain jahan trading range narrow ho rahi hoti hai. Yeh narrowing aksar is baat ka signal hoti hai ki market ek decision point ki taraf badh rahi hai.
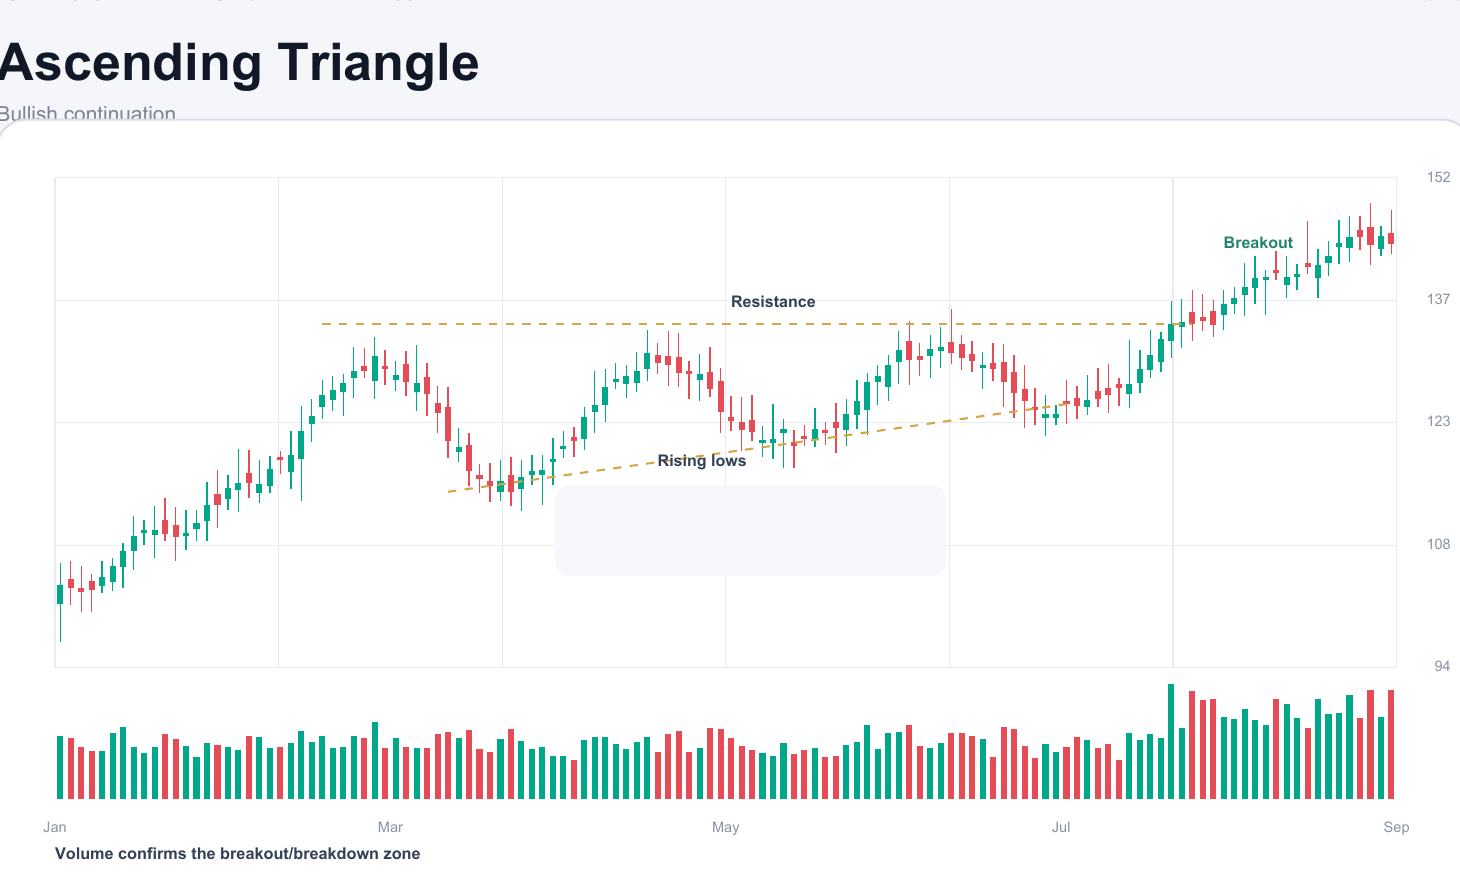
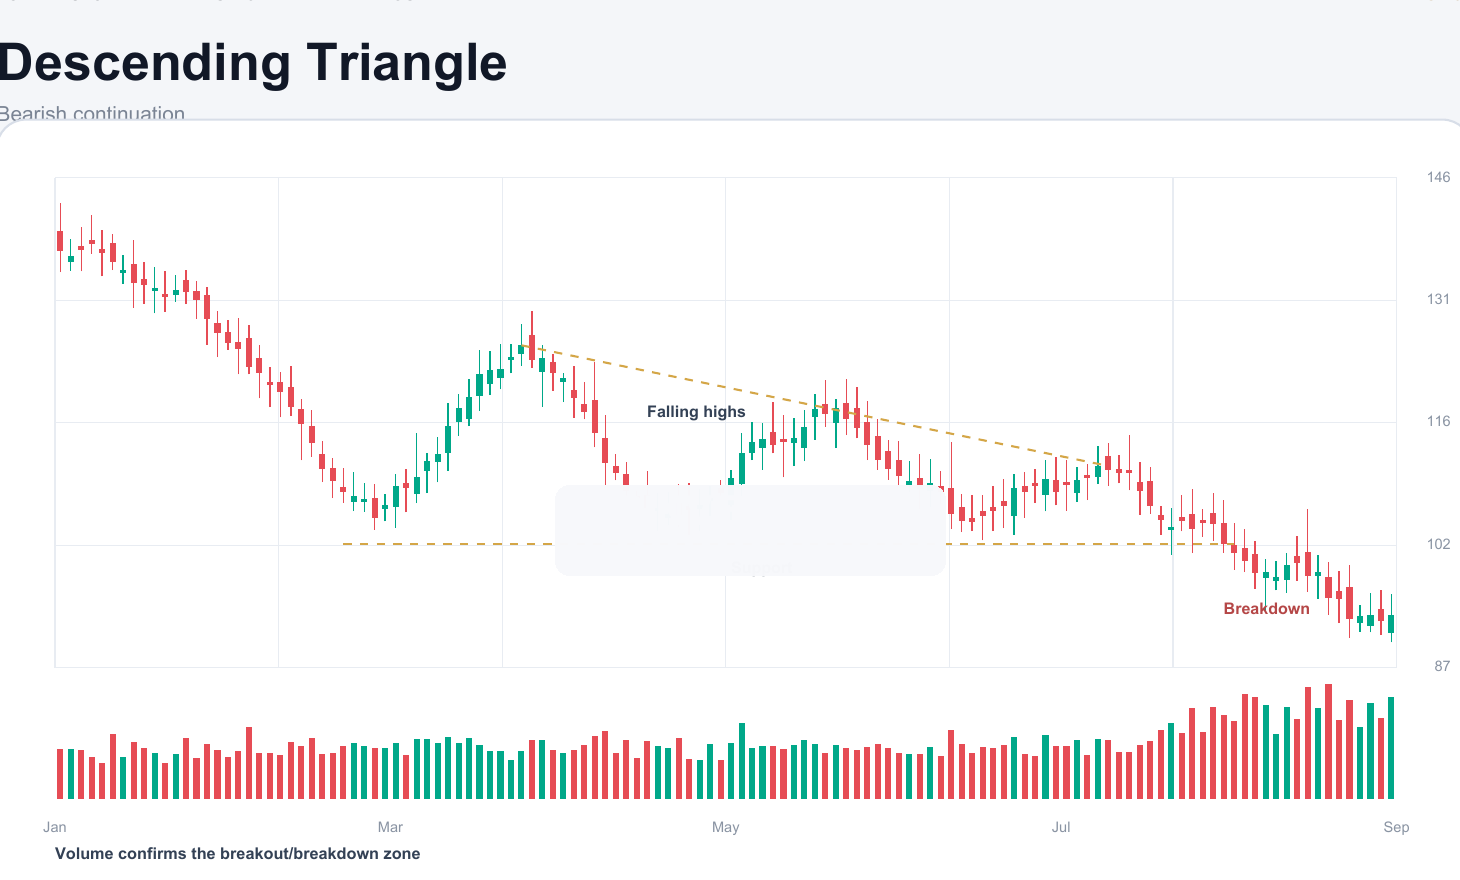
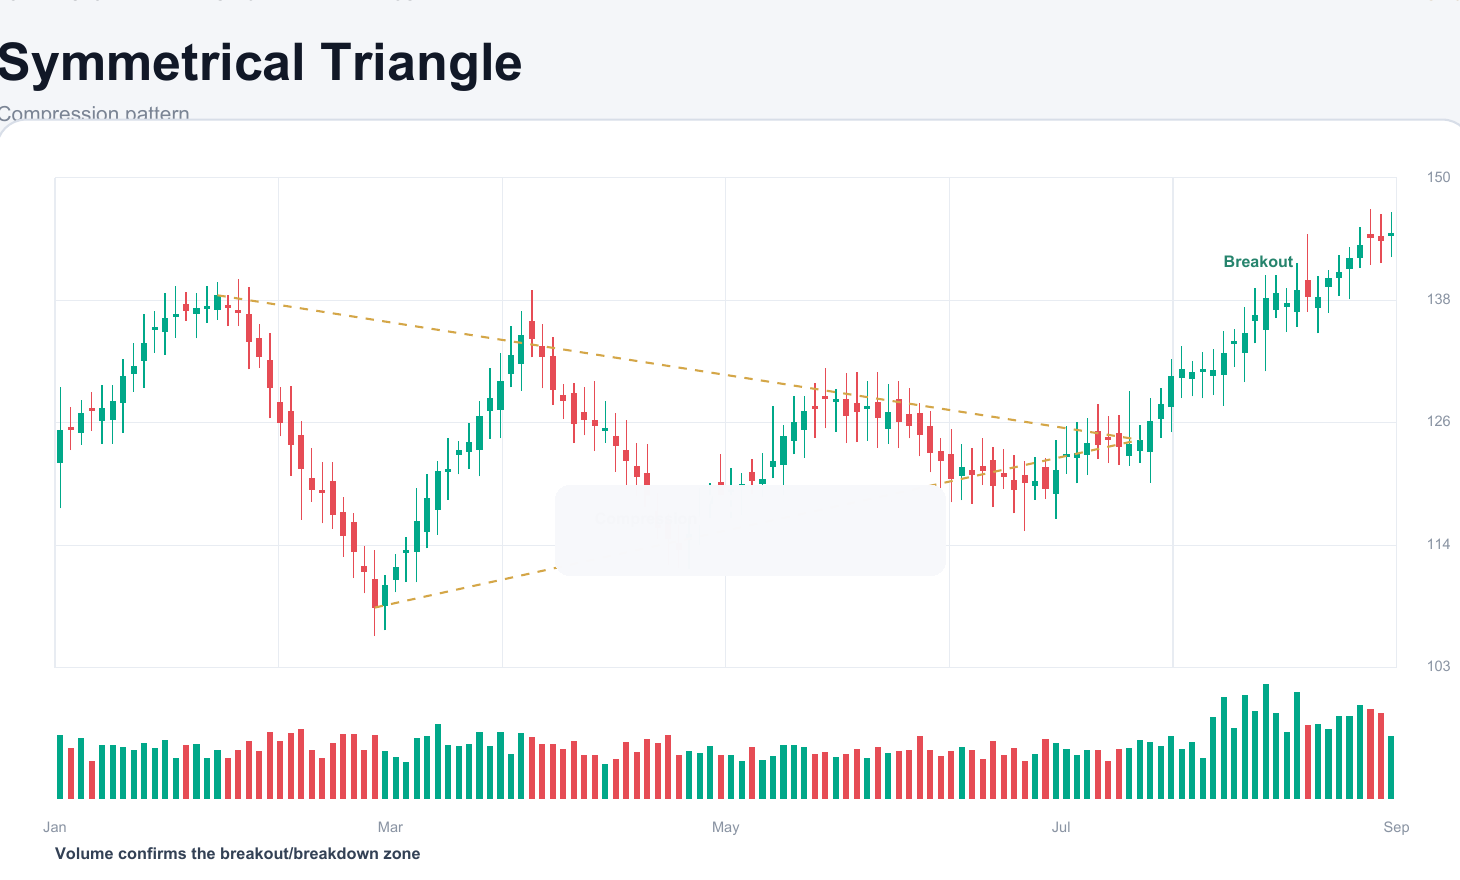
Ascending triangle yeh suggest karti hai ki buyers higher prices par step in kar rahe hain jabki resistance visible hai. Descending triangle me sellers lower highs par active hote ja rahe hain aur support pressure me hota hai. Symmetrical triangle temporary balance dikhati hai jahan direction bahut jaldi assume nahi karni chahiye.
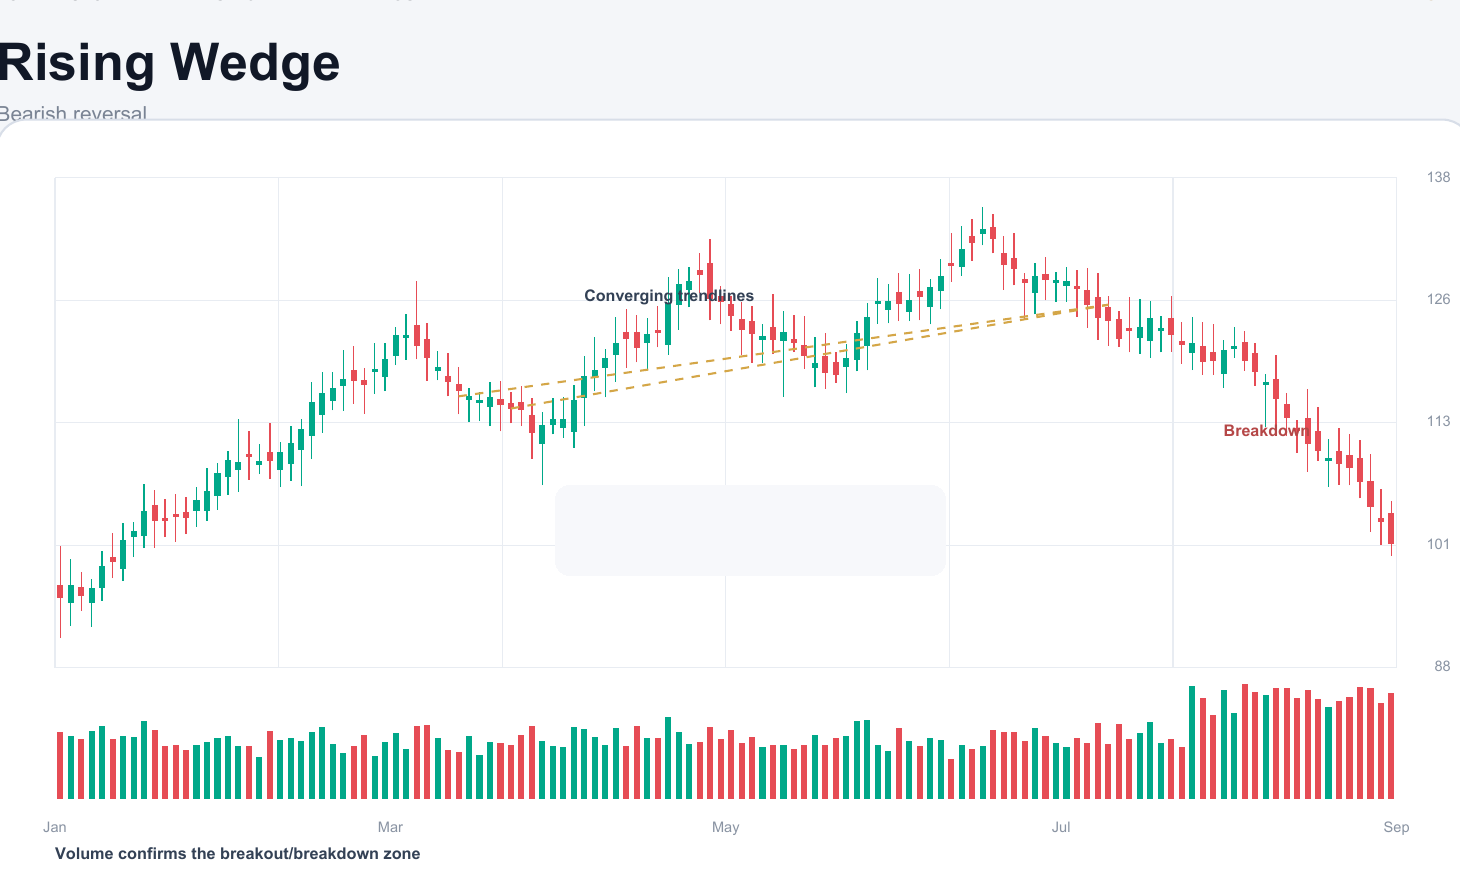
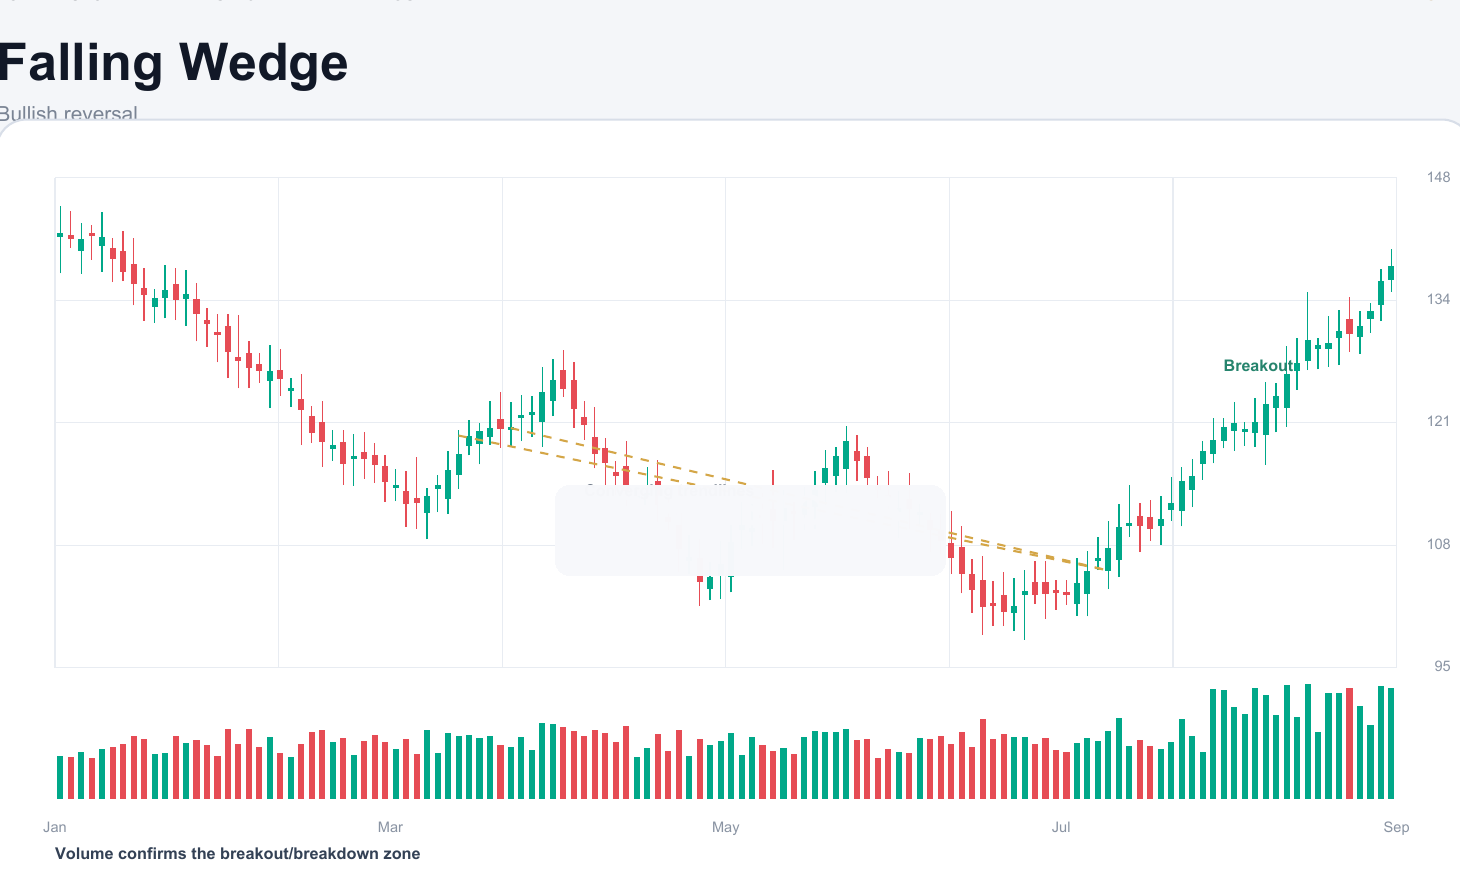
Wedges similar lagti hain, lekin slope add karti hain. Rising wedge weakening upside quality dikhati hai, jabki falling wedge gradually lose hoti selling pressure ka clue de sakti hai.
How Breakout Pressure Builds
Compression patterns isliye banti hain kyunki repeated reactions tighter space me hone lagti hain. Har swing chhoti hoti jati hai aur market later release ke liye energy store karti hai.
Ascending triangle me repeated higher lows buyers ki urgency dikhate hain. Descending triangle me repeated lower highs sellers ka support par pressure dikhate hain. Wedges me slope khud batata hai ki price abhi bhi progress kar rahi hai ya sirf lower quality move de rahi hai.
Key baat yeh hai ki pressure build-up aur breakout confirmation alag stages hoti hain. Traders aksar pehli cheez ko hi doosri samajh baithte hain.
Practical chart-reading example lo: 1000 ke paas ascending triangle bani ho jahan har dip previous dip se pehle buy ki ja rahi ho. Yeh rising urgency triangle label se zyada matter karti hai, kyunki yeh dikhati hai ki buyers resistance break hone se pehle hi higher prices accept kar rahe hain.
Breakout, Retest and False Breakout Risk
Breakout ideally structure ke bahar decisive close dikhani chahiye aur kam se kam itna evidence dena chahiye ki market boundary ke beyond prices accept kar rahi hai. Sirf intraday spike usually enough nahi hoti.
Retests useful hoti hain kyunki yeh dikhati hain ki broken boundary apna role flip kar sakti hai ya nahi. Old resistance ka support banna ya old support ka resistance banna breakout candle se bhi cleaner read de sakta hai.
False breakouts structure ke apex ke paas ya weak volume ke saath common hoti hain. Pattern jitni obvious hoti jati hai, crowded positioning ki wajah se shakeout ka chance utna badh sakta hai.
False breakout risk tab badh jati hai jab traders obvious boundaries ko front-run karte hain. Line ke thoda sa beyond move real acceptance ke barabar nahi hota. Isi difference se kai avoidable losses aati hain.
Entry, Stop and Target as Educational Logic
Trader educational entry trigger ke liye breakout ya retest use kar sakta hai, lekin entry tabhi sensible hai jab invalidation clear ho. Stops aksar structure ki opposite side ke beyond ya retest failure point ke beyond baithti hain.
Targets usually nearby levels, measured moves ya reward-risk planning par based estimates hoti hain. Inhe fixed promises ki tarah treat nahi karna chahiye. Agar market early momentum lose kar de, to chart aapko important information de rahi hoti hai.
Best setups sirf clean shapes nahi hoti. Woh clean shapes hoti hain jinke paas clear invalidation aur enough room hota hai jahan idea breathe kar sake.
Educational point ke liye, kaafi traders retest entry ke baad stop pattern ke just andar rakhte hain. Important exact formula nahi hai. Important yeh hai ki stop pattern failure ko reflect kare, emotional discomfort ko nahi.
Common Beginner Mistakes
Pehli mistake apex ke bahut paas entry le lena hai jab market ne abhi actual side choose hi nahi ki hoti.
Doosri mistake yeh assume karna hai ki har wedge automatically reversal hai. Context hi decide karti hai ki structure kitni matter karti hai.
Teesri mistake volume aur follow-through ko ignore karna hai jab break ho chuki ho.
Most Beginners Miss This
Compression pattern ka best lesson yeh hai ki pressure build-up aur actual release alag cheezein hain. Boundary ke bahar tike bina breakout ko real nahi maana jana chahiye.